 Request Proposal
RTO Valve Leakage: Diagnosing Outlet VOC Spikes and Heat Loss
An outlet VOC rise, an unexpected change in auxiliary-fuel demand, or a temperature pattern that no longer repeats cleanly can trigger a familiar conclusion: “the RTO valves must be leaking.” Sometimes that is correct. Often, it is only the beginning of the investigation.
RTO flow-reversal valves work in a demanding environment. They repeatedly direct hot process gas through ceramic beds, isolate paths during switching, and must do so while the process, duct network and controls are changing around them. A worn seal, a distorted seat, incomplete travel or mist/dust deposits can affect performance. But similar symptoms can also come from inlet concentration changes, a bypass path, purge configuration, a fan/duct problem, a sampling-system issue, or a control sequence that no longer matches the installed hardware.
For plant teams and technical buyers, the useful question is not “Can you replace our valves?” It is: What evidence shows where the gas is travelling, when the symptom occurs, and whether a valve repair is actually the right scope? This guide provides a general engineering diagnostic framework. It does not set a universal leakage limit or replace the installed RTO manual, approved isolation procedure, permit conditions, or site safety review.
1. Why valve sealing matters in a regenerative system
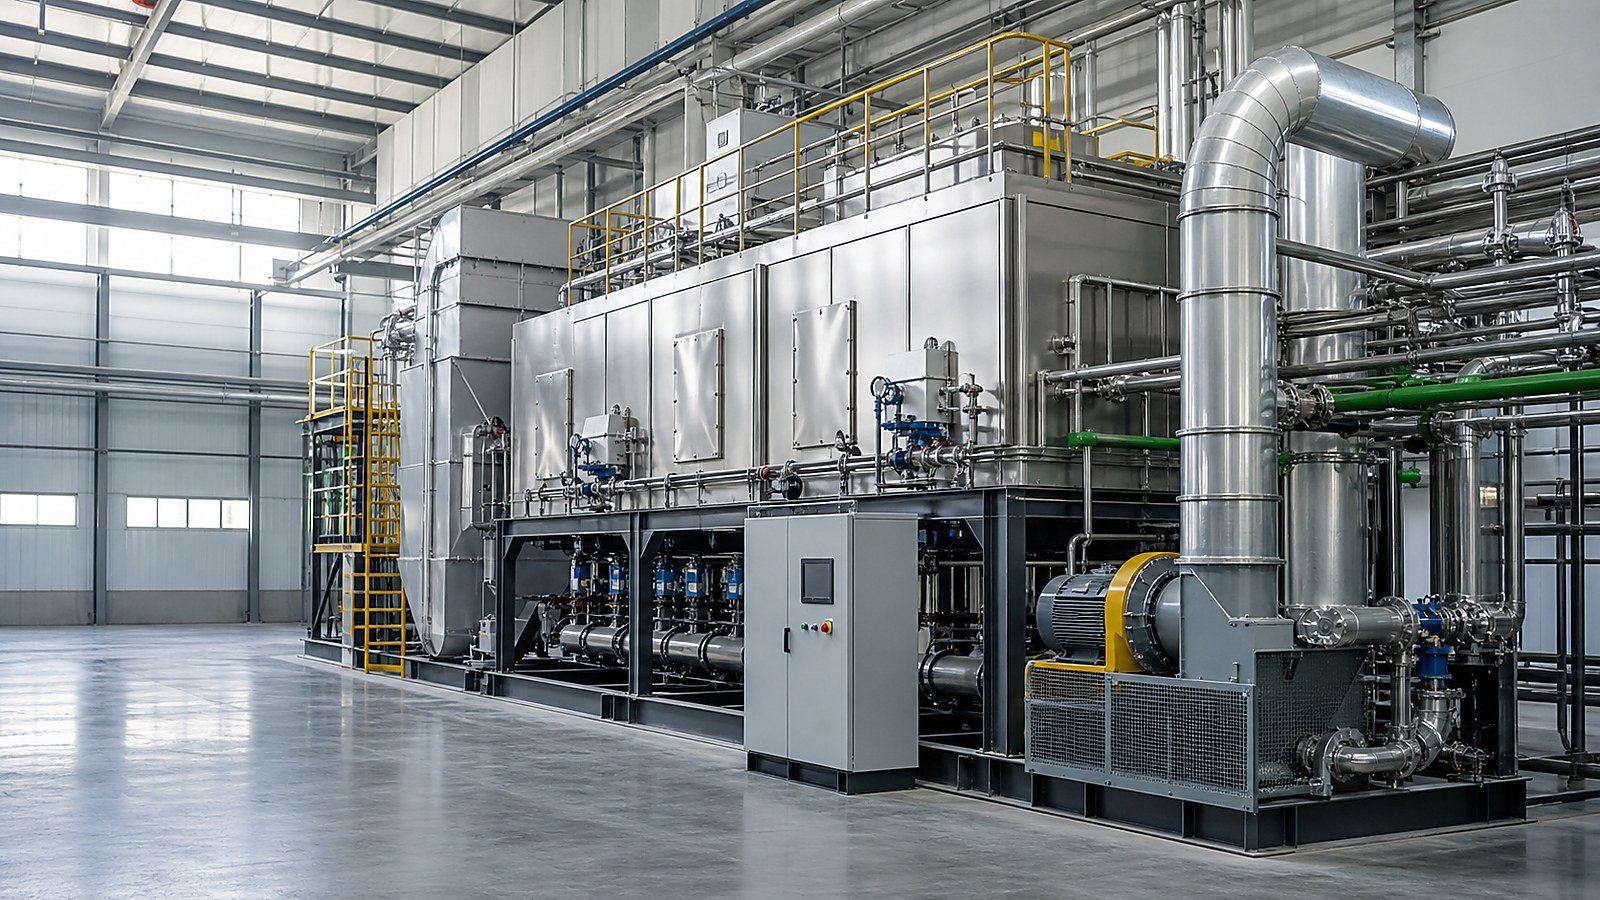
An RTO recovers heat by alternating gas flow through ceramic media. In a typical multi-bed arrangement, one bed is heated by treated gas while another preheats incoming process gas; a short purge or transition step may be used as the system reverses. The transfer-valve system is therefore part of the gas-path design, not a peripheral accessory.
If a valve does not seal or does not reach its commanded position, gas can take a path the control philosophy did not intend. Depending on the configuration, the observed effect may be residual untreated gas mixing with the treated stream, temperature imbalance between beds, additional cold-air ingress, a shifted purge volume, or lower apparent thermal recovery. The effect is not identical for every RTO: bed count, valve type, purge arrangement, VOC stream, fan location and operating mode all matter.
That is why a single outlet analyzer value is not enough to diagnose valve leakage. It reports a result at one point in the system; it does not, by itself, identify the path that created that result.
2. Recognize the symptoms—but treat them as clues, not proof
Suspected valve leakage often begins with a trend rather than a visible failure. The most valuable first step is to preserve that trend and compare it with the operating sequence.
Possible clues include:
- outlet VOC peaks that recur at or shortly after flow reversal;
- a growing difference between the temperature profile of nominally comparable beds;
- a change in fuel demand after process conditions are normalized for review;
- valve-position alarms, slow switching, repeated retries or feedback mismatch;
- a change in stack oxygen, pressure or flow trend that coincides with a switching event;
- deposits, corrosion, damaged insulation or abnormal noise near a valve housing; and
- a poor correlation between a portable check and the permanently installed analyzer.
Each clue has alternatives. A peak after reversal may be a purge-volume or analyzer-response issue. More fuel may be caused by lower inlet VOC concentration, excess air, air ingress, changed airflow or a damaged heat-exchange path. A position indicator can say “closed” even when a seal face is not fully seated. The diagnostic aim is to make those alternatives visible, not to choose one based on the first alarm.
3. Start with a controlled evidence pack
Before isolating equipment or ordering components, collect a time-aligned record over representative operating modes. The exact tags available will differ, but the following evidence pack makes a supplier or maintenance team far more effective.
| Evidence | What to compare | What it can help distinguish |
|---|---|---|
| Outlet VOC trend | Analyzer timestamp versus every valve reversal and purge step | Cycle-linked peaks versus process-driven variation |
| Inlet VOC, airflow and temperature | Normal, low-load, high-load, batch and cleaning conditions | Changed inlet heat value or gas volume versus equipment degradation |
| Bed and chamber temperatures | Same point in each cycle, not only daily averages | Repeatable bed imbalance or abnormal thermal carryover |
| Valve command and feedback | Command time, end-position feedback, travel time, retries and fault bits | Slow, incomplete or inconsistent actuation |
| Fan, duct and stack pressure | Before/after reversal and against historical baseline | Air ingress, flow disturbance or an unintended open path |
| Analyzer records | Calibration, sample flow, filters, heated-line condition, response delay | Measurement fault before mechanical intervention |
| Maintenance history | Seal material, actuator work, deposits, recent duct/process changes | Likely wear mechanism and changes in the original design basis |
Trend at a resolution that can see a whole reversal cycle. A daily average can hide a short excursion completely. At the same time, avoid declaring a fault from one cycle: capture comparable runs and note abnormal process events such as solvent changeover, wash-up, line stoppage or manual override.
4. Check the measurement chain before opening the valve system
An analyzer can be correct and still be telling the wrong diagnostic story if its sample is delayed, diluted, contaminated or not representative. Review where the sample probe sits, whether the line is heated where required, sample conditioning, filter condition, sample-flow alarms, calibration records, zero/span behavior and the known transport delay from probe to reading.
Then align the analyzer timebase with the PLC or historian. If a suspected event is only a few seconds long but the sample system has a longer or variable delay, the apparent peak may not line up with the actual valve event. A comparison with an approved portable method may be useful, but only when the method, location and safety controls are defined by the site. Do not open hot ducts or introduce an ad-hoc test point merely to obtain a quick reading.
This review also prevents a common procurement error: replacing seals because the permanent analyzer drifted or its sample path became restricted. A verified measurement chain turns a repair decision from a guess into an engineering decision.
5. Inspect the valve, actuator and sealing environment as one system
Once the operating evidence points toward the transfer-valve system, planned inspection should examine more than the seal itself. Exact lockout, cooldown, confined-space and hot-work requirements are site-specific and must be approved before access.
For the installed valve design, the inspection plan commonly needs to consider:
- seat, seal and contact surface condition: tearing, hardening, compression set, erosion, warping, deposits or corrosion;
- disc/poppet, damper blade or lifting mechanism alignment and evidence of rubbing;
- actuator torque/force, air supply or hydraulic/electrical condition, linkage wear and mechanical stops;
- actual end travel versus feedback-switch or encoder indication;
- housing distortion, loose fasteners, insulation damage and thermal expansion allowance;
- particulate, condensable mist, sticky polymer, acid-gas or abrasive-dust exposure that can damage sealing surfaces; and
- the condition of adjacent dampers, bypass paths, purge ducting and expansion joints.
Do not treat a closed-limit switch as a seal-verification test. It proves a selected mechanical or electrical point has been reached; it may not prove full contact along a hot, loaded sealing surface. The equipment manufacturer’s inspection method and acceptance criteria should govern the final judgment.

6. Use the switching sequence to separate likely causes
The timing of the symptom is a powerful diagnostic tool. Review the PLC sequence, operator actions and physical feedback together. The table below is not a fault codebook; it is a way to decide which evidence deserves the next inspection step.
| Observed pattern | Plausible explanations to test | Practical next check |
|---|---|---|
| Outlet peak repeats immediately after each reversal | Valve-seat leakage; purge volume/timing; analyzer transport delay; outlet-side mixing | Align raw analyzer, PLC state and purge tags over several cycles; verify sample-path delay before changing hardware |
| One bed diverges from comparable beds over several cycles | Valve sealing/travel issue; blocked or contaminated media path; uneven inlet distribution; thermocouple issue | Compare temperature trend, position feedback and pressure pattern; inspect instruments before opening media or valves |
| Fuel demand rises with lower inlet VOC concentration or higher airflow | Changed process heat contribution; flow/air ingress; thermal-recovery loss | Normalize the review for representative process load and verify airflow/pressure data |
| Feedback shows a completed stroke but travel time is variable | Actuator supply issue; linkage wear; binding; loose target/cam | Review stroke trend and physical end travel using the approved maintenance method |
| Outlet reading is unstable without a consistent cycle relationship | Inlet variability; analyzer/sample fault; downstream leak/mixing; process upset | Audit sampling and process data first; do not presume a valve cause |
If a leak path is confirmed, capture the condition before repair and repeat the same approved checks after repair. That before/after record is more valuable than a verbal statement that the equipment “looks better.” It helps confirm whether the repair addressed the observed failure mode and gives the owner a baseline for future maintenance.
7. Protect thermal recovery without making unsupported promises
Valve condition can influence thermal recovery, but the relationship is system-specific. Fuel use also changes with inlet VOC concentration, moisture, airflow, combustion temperature, ambient conditions, excess air, insulation condition, bypass operation and production schedule. Comparing monthly fuel totals alone can create a misleading conclusion.
For a meaningful review, select equivalent production periods or normalize the operating data as far as the available tags allow. Compare inlet flow and temperature, VOC loading where reliable, bed temperatures, combustion-chamber setpoint, fuel flow, stack conditions, valve state and the duration of each operating mode. Document any changed solvent, recipe, duct branch, fan setting or process line.
General RTO design information is available from the US EPA’s Regenerative Thermal Oxidizer fact sheet (source checked 2026-07-20). It is useful background, not a performance guarantee for a particular unit. The operating data and the installed design documents must determine what recovery change is credible at your plant.
8. Turn the diagnosis into a maintainable repair scope
The best repair scope includes the root cause and the evidence needed to detect recurrence. If deposits caused the seal problem, replacing the seal alone may not be enough; the upstream mist, dust, condensable or temperature issue must be reviewed. If the actuator is underpowered or the linkage is binding at temperature, a new seal may fail quickly. If the root cause was a configuration change, update the drawings and control narrative.
Ask a repair supplier or internal team to define the following in writing:
- The observed failure mode and the evidence that supports it.
- Parts/material specification compatible with temperature, chemistry and mechanical duty.
- Required inspection or alignment measurements before reassembly.
- Actuator, feedback, interlock and sequence checks after reassembly.
- The approved method for confirming the gas-path performance after the work.
- Any upstream mitigation, cleaning interval, spares or inspection frequency proposed—and the condition that triggers it.
- Updated drawings, maintenance records, setpoint-change control and operator handover.
Maintenance intervals should be condition-based wherever possible. A calendar interval can be a useful starting point, but it cannot substitute for trends, inspections and process-change review. The same principle applies to any “acceptable leakage” number: use the OEM and project-specific criteria rather than borrowing a value from a different valve design or service.
FAQ
Can high outlet VOC prove that an RTO valve is leaking?
No. It is a symptom that needs to be compared with the valve cycle, inlet conditions, purge sequence, pressures and analyzer performance. A controlled evidence pack is needed before calling it a valve fault.
What is the first check when an outlet peak appears after reversal?
Confirm the analyzer/sample-path response and align its timestamps with the PLC state and purge timing across several comparable cycles. This avoids confusing an instrument delay or purge effect with a mechanical leak.
Does a closed-position limit switch prove that the valve seals?
Not necessarily. It proves the configured feedback point has been reached. Seal contact under operating conditions may require a separate approved inspection or test method for the installed valve.
Will replacing a valve seal reduce fuel consumption?
It may help if a confirmed gas-path fault is affecting thermal recovery, but fuel use has multiple causes. Compare normalized operating data before and after an approved repair; do not promise a savings figure without plant-specific evidence.
What information should be sent for a valve-maintenance quotation?
Provide the RTO model/configuration, valve drawings/photos where permitted, process gas and temperature range, operating trends, alarm history, valve command/feedback data, maintenance records, contaminants/deposits, safety requirements and the desired scope of testing/documentation.
Discuss the evidence before approving the repair
SERNO can help review the information needed for an RTO valve-maintenance scope: configuration, process conditions, cycle trends, inspection findings and the documentation required for your project. Start with the RTO product overview, compare operating considerations in the RTO maintenance checklist, review RTO pressure drop and fan sizing, and send the available data through the project inquiry form. Final diagnosis, safety controls and acceptance criteria must be confirmed for the installed system and site.